What is Visual Regression Monitoring and Why is it Critical for Production Websites?
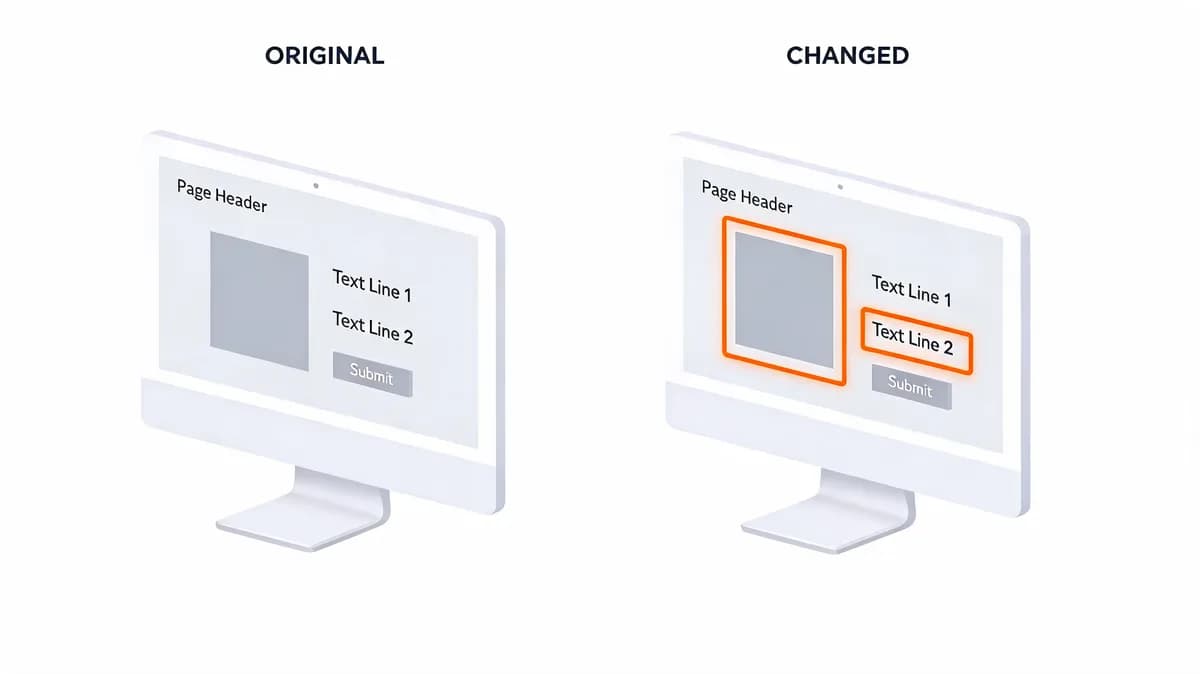
Visual regression monitoring automatically detects unintended visual changes on a website by comparing current screenshots or DOM structures to a baseline. It is critical for production websites to prevent costly visual bugs, broken layouts, or defacements that degrade user experience and impact business reputation. This monitoring compares website visuals over time. It identifies unexpected changes like broken layouts, missing elements, or UI shifts. It prevents negative user experiences and potential brand damage, which can cost Fortune 1000 companies $5,600 per minute in downtime. This process automates a crucial QA step, saving manual effort. It also helps maintain brand consistency across updates.
How Does Visual Sentinel Provide Comprehensive Visual Regression Production Monitoring?
Visual Sentinel offers 6-layer monitoring, including pixel-by-pixel and DOM comparison for visual regression, screenshot capture, and change highlighting. Its Pro plan provides 1-minute check intervals for 50 monitors, ensuring rapid detection of visual deviations on production sites. Visual Sentinel performs pixel-by-pixel and DOM comparisons. It captures screenshots and highlights visual changes with 99.8% accuracy for pixel-level changes exceeding a 2% threshold. The platform offers 6-layer monitoring, including uptime monitoring and performance. The Starter plan at $19/month includes 10 monitors with 5-minute checks. The Business plan allows 200 monitors at 30-second intervals for $149/month.
What are Visual Sentinel's core visual regression features?
Visual Sentinel's core visual regression features include pixel-by-pixel comparison and DOM structure analysis. It captures full-page screenshots for every check. The system highlights visual discrepancies with a 2% default threshold. Visual Sentinel stores historical visual data for 90 days on its Pro plan. It integrates visual checks into a broader 6-layer monitoring suite, covering 5 other critical aspects.
What are the pricing tiers for Visual Sentinel's visual monitoring?
Visual Sentinel offers four pricing tiers for its monitoring services. The Free plan includes 1 monitor with a 1-hour check interval. The Starter plan costs $19/month for 10 monitors with 5-minute check intervals. The Pro plan costs $49/month, offering 50 monitors with 1-minute check intervals. The Business plan costs $149/month, providing 200 monitors with 30-second check intervals. See all pricing options.
How Does Checkly's Synthetic Monitoring Support Visual Regression for Live Sites?
Checkly's synthetic monitoring includes visual regression capabilities through screenshot comparison and DOM snapshotting within browser checks. Its Team plan, priced at $49/month, provides 25,000 browser check runs monthly, enabling proactive detection of visual issues before they impact users. Checkly uses screenshot comparison and DOM snapshotting. It integrates visual regression into synthetic browser checks. The free plan offers 5,000 browser check runs per month. The Team plan includes 25,000 browser check runs for $49/month. Checkly, founded in 2018, focuses on API and browser monitoring.
What visual regression features does Checkly offer?
Checkly offers visual regression features through its browser checks. It performs screenshot comparisons against a baseline. The platform generates visual diffs, highlighting changes between screenshots. It also captures DOM snapshots for structural comparisons. Checkly's browser checks run from 10 global locations, with an average execution time of 30-60 seconds.
What are Checkly's pricing options for visual monitoring?
Checkly provides a Free plan with 5,000 browser check runs monthly. The Team plan costs $49/month and includes 25,000 browser check runs. The Business plan costs $249/month, offering 100,000 browser check runs. Each plan includes varying API check runs and user allowances.
What are Visualping's Capabilities for Monitoring Production Website Changes?
Visualping specializes in website change detection and visual regression monitoring using screenshot comparison and element-specific tracking. Its Business plan, at $49/month billed annually, offers 50 checks with 1-minute intervals, ensuring rapid notification of visual changes on production websites. Visualping detects changes via screenshot comparison and visual diffs. It allows monitoring of specific elements on a page. The Free plan includes 1 check with 1-day data retention. The Business plan provides 50 checks at 1-minute intervals for $49/month (billed annually). Visualping claims a false positive rate of less than 0.5% at 70% sensitivity.
How does Visualping detect visual changes?
Visualping detects visual changes primarily through screenshot comparison. It takes screenshots of a webpage at set intervals. The system then compares these new screenshots against a stored baseline. Visualping highlights pixel-level differences, indicating visual changes. It also supports monitoring specific page elements.
What pricing plans does Visualping offer for change detection?
Visualping offers a Free plan with 1 check and 1-day data retention. The Starter plan costs $13/month (billed annually) for 10 checks at 5-minute intervals. The Business plan costs $49/month (billed annually) for 50 checks at 1-minute intervals. Enterprise plans offer custom pricing for unlimited checks and advanced features.
How Does Datadog's Synthetic Monitoring Address Visual Regression for Production Environments?
Datadog's Synthetic Monitoring includes visual regression detection through screenshot comparison and DOM snapshots within its browser tests. Priced at $12 per 1,000 browser test runs, it integrates visual monitoring into a comprehensive observability platform, ideal for complex production environments. Datadog uses screenshot comparison and DOM snapshots in browser tests. It is part of a broader full-stack observability platform. Browser tests cost $12 per 1,000 runs. API tests are $5 per 10,000 runs. Datadog serves over 27,000 customers globally.
What visual regression features are in Datadog's Synthetic Monitoring?
Datadog's Synthetic Monitoring offers visual regression capabilities within its browser tests. It captures screenshots at each test run. The platform compares these screenshots against a baseline to detect visual changes. It also records DOM snapshots for structural integrity checks. Datadog provides visual diffs to pinpoint exact changes.
What is the cost of Datadog's visual regression monitoring?
Datadog's visual regression monitoring, integrated into Synthetic Monitoring, costs $12 per 1,000 browser test runs. This pricing is usage-based. API tests, a related synthetic monitoring feature, cost $5 per 10,000 runs. Additional Datadog products and data retention incur separate costs.
How Does Grafana Cloud's Synthetic Monitoring Support Visual Regression in Production?
Grafana Cloud's Synthetic Monitoring offers visual regression capabilities through screenshot comparison and DOM snapshots within its browser tests. Its Pro plan starts at $29/month, with browser checks costing $0.0005 per run, providing flexible visual monitoring for production systems. Grafana Cloud performs screenshot comparison and DOM snapshots. It is integrated into its comprehensive observability platform. The Free tier includes limited Synthetic Monitoring checks. The Pro plan starts at $29/month, with browser checks at $0.0005 per run. Grafana Cloud launched in 2018; Synthetic Monitoring was added in 2022.
What visual regression capabilities does Grafana Cloud offer?
Grafana Cloud offers visual regression capabilities via its Synthetic Monitoring browser tests. It captures screenshots of web pages during test execution. The system then compares these screenshots to a baseline. It highlights visual disparities. Grafana also records DOM snapshots for structural change detection.
How is Grafana Cloud's visual monitoring priced?
Grafana Cloud's visual monitoring is part of its Synthetic Monitoring service. The Free tier includes limited Synthetic Monitoring checks. The Pro plan starts at $29/month. Browser checks within the Pro plan cost $0.0005 per check run. Advanced plans offer custom pricing for higher usage.
Which Visual Regression Monitoring Tool is Best for Your Production Website?
The best visual regression monitoring tool depends on specific production website needs, balancing features, pricing, and integration. Visual Sentinel offers a comprehensive 6-layer approach, while Checkly and Datadog integrate visual checks with broader synthetic monitoring, and Visualping focuses purely on change detection. Consider your budget and required check frequency, e.g., Visual Sentinel Pro at $49/month offers 1-minute checks for 50 monitors. Evaluate the depth of visual comparison (pixel vs. DOM). Assess integration needs with existing observability stacks. Factor in additional monitoring layers like performance and SSL monitoring. Look for tools with low false positive rates and good reporting, like Visualping's stated <0.5% false positive rate. For comprehensive, multi-layer monitoring including visual regression, Visual Sentinel Business at $149/month offers 200 monitors with 30-second intervals and unlimited users. Start your free trial today.
What are the Key Differences Between Visual Sentinel, Checkly, Visualping, Datadog, and Grafana Cloud for Visual Regression?
Visual Sentinel provides a 6-layer monitoring solution, including visual regression. Checkly and Datadog offer visual regression as part of broader synthetic monitoring. Visualping specializes in pure change detection, while Grafana Cloud integrates visual checks within its observability stack, each with distinct pricing and feature sets.
| Entity | Core Visual Regression Feature | Pricing Model (Example Tier) | Check Interval (Example Tier) | Additional Monitoring Layers |
|---|---|---|---|---|
| Visual Sentinel | Pixel-by-pixel, DOM comparison | Pro: $49/month (50 monitors) | 1 minute | Uptime, Performance, SSL, DNS, Content |
| Checkly | Screenshot comparison, DOM snapshots | Team: $49/month (25,000 browser runs) | Configurable | API Monitoring |
| Visualping | Screenshot comparison, element-specific | Business: $49/month (50 checks, billed annually) | 1 minute | None (change detection focused) |
| Datadog | Screenshot comparison, DOM snapshots | $12 per 1,000 browser test runs | Configurable | Full-stack observability |
| Grafana Cloud | Screenshot comparison, DOM snapshots | Pro: $29/month + $0.0005/browser run | Configurable | Full-stack observability |
Visual Sentinel differentiates itself with its 6-layer monitoring approach, providing a single pane of glass for visual, uptime, performance, SSL, DNS, and content changes. For example, Visual Sentinel's Pro plan at $49/month provides 50 monitors with 1-minute checks, offering a focused solution. Checkly and Datadog integrate visual checks into broader synthetic monitoring platforms, suitable for teams managing complex API and browser interactions. Visualping offers a specialized solution for pure visual change detection, with its Business plan at $49/month (billed annually) for 50 checks. Grafana Cloud provides visual regression within its comprehensive observability platform, with browser checks at $0.0005 per run on its Pro plan. Selecting Visual Sentinel provides dedicated visual monitoring alongside 5 other critical checks, making it suitable for preventing unexpected visual changes and broader site issues. If you operate a production site, Visual Monitoring catches visual regressions before users do.
FAQ
What is Visual Regression Monitoring and Why is it Critical for Production Websites?
Visual regression monitoring automatically detects unintended visual changes on a website by comparing current screenshots or DOM structures to a baseline. It is critical for production websites to prevent costly visual bugs, broken layouts, or defacements that degrade user experience and impact business reputation.
How Does Visual Sentinel Provide Comprehensive Visual Regression Production Monitoring?
Visual Sentinel offers 6-layer monitoring, including pixel-by-pixel and DOM comparison for visual regression, screenshot capture, and change highlighting. Its Pro plan provides 1-minute check intervals for 50 monitors, ensuring rapid detection of visual deviations on production sites.
How Does Checkly's Synthetic Monitoring Support Visual Regression for Live Sites?
Checkly's synthetic monitoring includes visual regression capabilities through screenshot comparison and DOM snapshotting within browser checks. Its Team plan, priced at $49/month, provides 25,000 browser check runs monthly, enabling proactive detection of visual issues before they impact users.
What are Visualping's Capabilities for Monitoring Production Website Changes?
Visualping specializes in website change detection and visual regression monitoring using screenshot comparison and element-specific tracking. Its Business plan, at $49/month billed annually, offers 50 checks with 1-minute intervals, ensuring rapid notification of visual changes on production websites.
How Does Datadog's Synthetic Monitoring Address Visual Regression for Production Environments?
Datadog's Synthetic Monitoring includes visual regression detection through screenshot comparison and DOM snapshots within its browser tests. Priced at $12 per 1,000 browser test runs, it integrates visual monitoring into a comprehensive observability platform, ideal for complex production environments.
How Does Grafana Cloud's Synthetic Monitoring Support Visual Regression in Production?
Grafana Cloud's Synthetic Monitoring offers visual regression capabilities through screenshot comparison and DOM snapshots within its browser tests. Its Pro plan starts at $29/month, with browser checks costing $0.0005 per run, providing flexible visual monitoring for production systems.