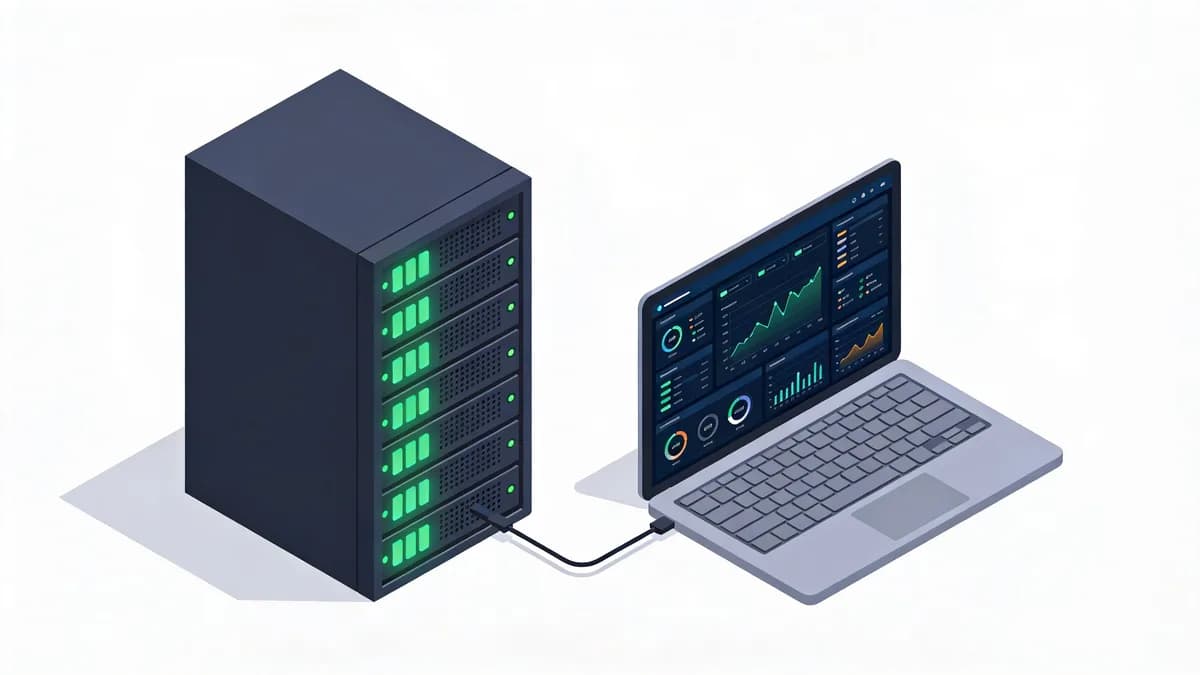
What Metrics Define Effective Homelab Monitoring in 2026?
Homelab monitoring in 2026 focuses on uptime availability, response times, SSL certificate validity, DNS resolution speed, visual regressions, and content changes. Tools like Netdata (open-source agent, free community edition) collect high-resolution metrics for servers and containers every second to help investigate problems. Uptime checks run on a schedule. Choose thresholds for performance metrics, such as CPU load under 70% and bandwidth usage below 80% capacity.
Netdata (open-source agent) collects hardware sensor metrics through its collectors and has 800+ integrations. Checkmk (open-source edition, free) is a separate monitoring system that discovers hosts and services automatically. Uptime Monitoring checks websites from Europe and the US.
Content and visual tools have different scopes. Visual Sentinel checks expected page text and compares screenshots. DNS resolution observations help investigate record problems.
Visual Sentinel checks certificate validity and expiry, with default reminders at 13, 3 and 1 days before expiry. Response observations help investigate performance without guaranteeing page load times.
How Does Uptime Monitoring Detect Downtime in Self-Hosted Homelabs?
Uptime monitoring checks homelab websites using HTTP/HTTPS on a schedule. Tools like UptimeRobot (free tier, 50 monitors) provide basic checks for hobbyist setups. Configure notifications for the availability conditions you need to investigate. UptimeRobot (free tier, 50 monitors) supports 5-minute intervals. Free tiers keep costs down for a small homelab.
HTTP/HTTPS protocols verify status codes 200-299 as healthy. A failed check needs investigation rather than proving a network problem. SSL Monitoring checks certificate validity and expiry.
What Open-Source Tools Offer Real-Time Performance Monitoring for Homelabs?
Netdata provides real-time metrics collection with machine learning anomaly detection for containers and Kubernetes at $90/year for homelabs. Prometheus (free) excels in cloud-native metric scraping every 15-60 seconds and pairs with Grafana (free community edition) for dashboards. Teams can use these tools to observe self-hosted performance.
Netdata (home lab license, $90/year) monitors CPU usage every second and uses machine-learning models trained on each metric to flag unusual behaviour. Prometheus (free) scrapes endpoints over HTTP; the default interval is 1 minute and many setups use 15 seconds.
Netdata's High-Resolution Collection
Netdata (home lab license, $90/year) supports 800+ integrations. Checkmk (open-source edition, free) discovers the services on each host automatically. Performance Monitoring provides separate website performance observations.
Netdata (home lab license, $90/year) collects metrics every second. Machine learning flags a metric when it departs from its own recent pattern, so a memory jump can be flagged even below a fixed limit.
Prometheus for Container Metrics
Prometheus stores collected samples, and Grafana can query them for dashboards. Zabbix (free) offers customizable alerts for network latency.
Zabbix supports agentless discovery. Prometheus (free) can federate metrics from other Prometheus servers.
| Tool | Metrics Collection Interval | Anomaly Detection Method | Best for |
|---|---|---|---|
| Netdata (home lab license, $90/year) | 1 second | Machine learning | Per-second metrics on a few hosts and containers |
| Prometheus (free) | 15-60 seconds | Rule-based alerting | Container and Kubernetes metrics with Grafana |
| Zabbix (free) | You set it per item | Threshold triggers | Network devices and SNMP |
| Checkmk (open-source edition, free) | 1 minute | Rule-based service checks | Hosts and services with automatic discovery |
How Can Affordable Tools Detect Visual Changes in Homelab Websites?
PageCrawl's free tier uses a full browser engine to render JS/SPA content and detects visual regressions with screenshot diffs every 60 minutes across 6 monitors. PageCrawl (free tier, 220 checks/month) includes AI summaries scoring changes 0-100 and allows more checks per month than Visualping (free tier, 150 checks/month). Review screenshot differences against the intended page behavior.
PageCrawl (free tier, 220 checks/month) renders JavaScript with a browser engine. Choose screenshot comparison settings for the page. Visual Monitoring compares website screenshots on a schedule.
PageCrawl's AI scores each change from 0 to 100 and you set the minimum score that sends a notification (the free plan includes 15 AI credits a month). The free plan can also sync changes to Google Sheets. Netdata (home lab license, $90/year) pairs with PageCrawl (free tier, 220 checks/month) for holistic oversight of server-website performance.
Visualping (free tier, 150 checks/month) checks up to every 60 minutes. PageCrawl (free tier, 220 checks/month) supports browser rendering for dynamic content.
What Features Make Zabbix Suitable for Homelab Network Monitoring?
Zabbix monitors servers and networks with customizable templates, agentless discovery, and alerts for the thresholds you set. Zabbix (free) is open source with no per-device fees, which suits hobbyists. Templates cover metrics including bandwidth and packet loss.
Zabbix (free) supports agentless device discovery. Zabbix (free) can run a DNS check on a schedule you set and alert when it fails or runs slowly. DNS Checker verifies propagation alongside it.
Open-source nature eliminates per-device fees. Zabbix (free) can track packet loss on the links you monitor.
Customizable Dashboards
Zabbix (free) builds dashboards from widgets for real-time views. Users customize triggers for the bandwidth level they care about. Grafana (free community edition) integrates Zabbix (free) data for advanced panels.
Integration with Grafana
Zabbix (free) exports metrics to Grafana (free community edition) via API. OpenObserve (open-source, free) can run SQL-based alerts alongside Zabbix (free).
How Do Free Tiers Compare for Content Change Detection in Homelabs?
PageCrawl offers 6 free monitors with 220 checks/month at 60-minute intervals and AI filtering, against Visualping's 5 pages with 150 checks/month at up to 60-minute intervals. Both tools detect text/visual diffs affordably, and PageCrawl allows more checks per month. PageCrawl (free tier, 220 checks/month) supports Slack or Discord notifications.
Visualping (free tier, 150 checks/month) includes email, webhook and Telegram alerts plus visual, text and element change detection; Slack and Teams are on Business plans. PageCrawl (free tier, 220 checks/month) filters noise with an importance threshold you set. Content Monitoring explores advanced setups.
The self-hosted changedetection.io project is open source, and you set how often each watch is checked. PageCrawl (free tier, 220 checks/month) supports browser-rendered content. Visualping (free tier, 150 checks/month) suits a handful of pages (5 pages, up to every 60 minutes).
Distill.io (free tier, 1,000 checks/month) offers 5 cloud monitors at 6-hour intervals. ChangeTower (free tier) checks 3 pages once a day.
| Tool | Free Monitors | Checks per Month | Minimum Frequency | AI Filtering Available |
|---|---|---|---|---|
| PageCrawl (free tier) | 6 | 220 | 60 minutes | Yes, scores 0-100 |
| Visualping (free tier) | 5 | 150 | 60 minutes | Yes (AI summaries) |
| Distill.io (free tier) | 5 cloud + 20 local | 1,000 | 6 hours | No |
| ChangeTower (free tier) | 3 | Not published (3 pages, once a day) | Daily | Yes |
What Role Does Grafana Play in Homelab Dashboard Visualization?
Grafana aggregates metrics from Prometheus and Netdata into customizable dashboards with alerting on anomalies like 80% CPU spikes. Grafana (free community edition) supports many data sources, including Prometheus, and eases setup for people visualizing homelab performance. Prebuilt panels display uptime and response time graphs.
Grafana queries Prometheus data for dashboards.
Alerting Configurations
Grafana (free community edition) configures alerts on CPU over 80% via webhook. Alerts can notify channels such as Slack and PagerDuty. Choose availability targets for your services.
Multi-Source Integration
Grafana (free community edition) integrates Netdata (home lab license, $90/year) and Zabbix (free) for unified views. Speed Test provides separate website performance observations. Nagios (free) provides basic dashboards. Grafana (free community edition) enriches them with time-series data from your other sources. Dashboards help teams review changes in collected metrics.
How to Integrate Tools for Comprehensive Homelab Change and Uptime Tracking?
Combine Prometheus for metrics, PageCrawl for visual/content changes, and Grafana for unified dashboards to review different aspects of homelab health. The setup provides metrics and change notifications for DevOps hobbyists avoiding SaaS lock-in. APIs enable Zabbix-Netdata data flow where the integrations support it.
Step-by-Step Integration
- Install Prometheus (free) using its installation instructions.
- Configure Netdata (home lab license, $90/year) exporters to Prometheus (free) endpoints.
- Send PageCrawl change notifications to Slack or Discord, and configure Grafana metric alerts separately.
- Set Zabbix templates for the metrics you want to see in Grafana.
Visual Sentinel vs UptimeRobot compares alternatives for uptime checks.
Alert Workflow Setup
Grafana (free community edition) can route alerts to Slack for a user-set CPU threshold. PageCrawl (free tier, 220 checks/month) lets you set a minimum importance score for notifications. Test that alerts reach the responsible people.
To cover a homelab site from the outside:
- Add the site to an uptime check with a 5-minute or faster interval.
- Turn on SSL expiry reminders for every HTTPS host.
- Add a visual or content check on the pages that change.
- Send alerts to a channel you read, such as Slack, Discord or email.
- Trigger a test alert and confirm it arrives.
More articles cover other self-hosted monitoring setups.
Check your site while you read
Run a free check for regional reachability, response time, redirect handling, TLS evidence, and DNS resolution. No account is required.
Check a site freeCommon questions
What Metrics Define Effective Homelab Monitoring in 2026?
Homelab monitoring in 2026 focuses on uptime availability, response times, SSL certificate validity, DNS resolution speed, visual regressions, and content changes. Tools like Netdata collect high-resolution metrics for servers and containers to help investigate problems.
How Does Uptime Monitoring Detect Downtime in Self-Hosted Homelabs?
Uptime monitoring checks websites on a schedule. UptimeRobot provides basic checks, and Website Checker offers a separate manual website check.
What Open-Source Tools Offer Real-Time Performance Monitoring for Homelabs?
Netdata provides real-time metrics collection with machine learning anomaly detection for containers and Kubernetes at $90/year for homelabs. Prometheus excels in cloud-native metric scraping every 15-60 seconds, paired with Grafana for dashboards, ideal for small teams tracking self-hosted performance.
How Can Affordable Tools Detect Visual Changes in Homelab Websites?
PageCrawl's free tier uses a full browser engine to render JS/SPA content, detecting visual regressions with screenshot diffs every 60 minutes across 6 monitors. It includes AI summaries scoring changes 0-100, and gives you 6 monitors and 220 checks/month against Visualping's 5 pages and 150 checks/month.
What Features Make Zabbix Suitable for Homelab Network Monitoring?
Zabbix monitors servers and networks with customizable templates, agentless discovery, and alerts for the thresholds you set. Zabbix is open source with no per-device fees, which suits hobbyists.
How Do Free Tiers Compare for Content Change Detection in Homelabs?
PageCrawl offers 6 free monitors with 220 checks/month at 60-minute intervals and AI filtering, against Visualping's 5 pages with 150 checks/month at up to 60-minute intervals. Both detect text and visual changes, and PageCrawl allows more checks per month.