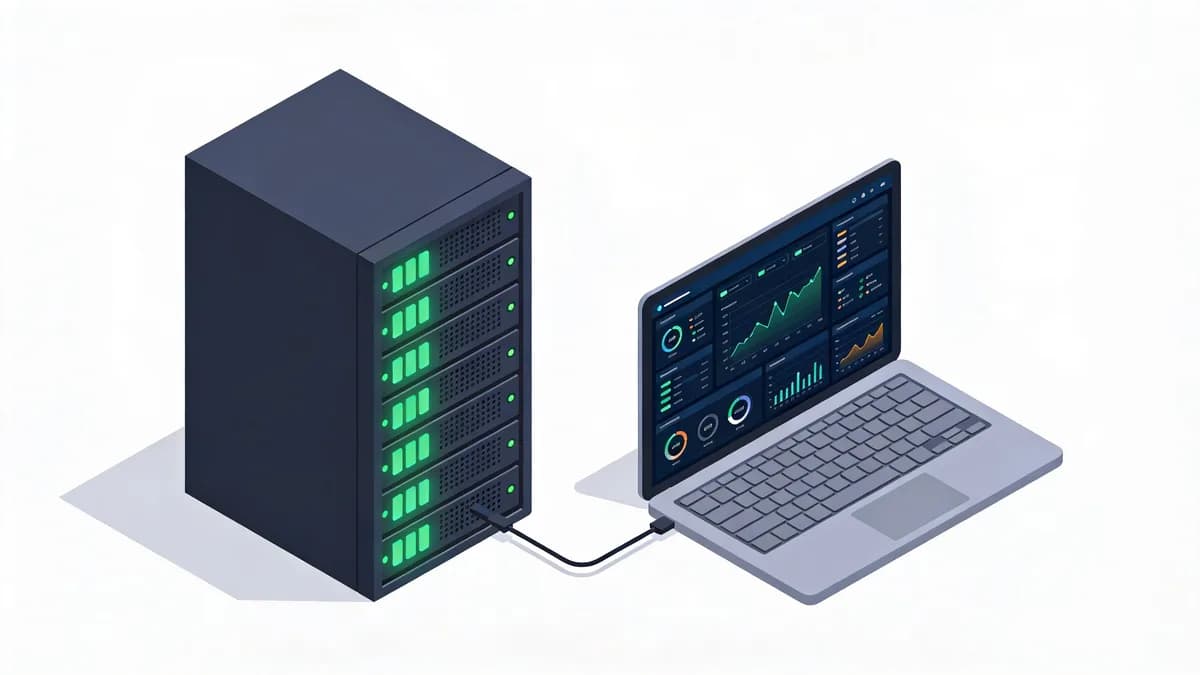
Homelab Monitoring Dashboard Guide
Build a homelab monitoring dashboard with Grafana, Prometheus and Telegraf: install Node Exporter, scrape it, import a ready-made dashboard, add alerts, and ship logs to Loki with Grafana Alloy.
Field notes
Expert guides and insights about homelab monitoring.
Showing 2 articles. Page 1 of 1.
Build a homelab monitoring dashboard with Grafana, Prometheus and Telegraf: install Node Exporter, scrape it, import a ready-made dashboard, add alerts, and ship logs to Loki with Grafana Alloy.

In 2026, homelab enthusiasts can leverage Netdata's $90/year license for real-time anomaly detection and PageCrawl's free tier for 220 monthly checks to monitor self-hosted websites. These tools provide availability and change observations. Combine them with Prometheus for comprehensive container insights.
Your first check is free when you add your site. Then try a paid plan for 7 days (card required) or subscribe, from $15 USD a month.
Start 7-day trial