What Is API Performance Monitoring and How Does It Integrate with Website Uptime?
API performance monitoring observes response time, errors and request volume. Compare endpoint checks with Uptime Monitoring. Visual Sentinel checks from Europe and the US, with uptime checks as often as every minute on Business and Agency.
Configure appropriate synthetic checks and alert conditions for the service. An error-rate alert, say at 5 percent of requests, is a threshold you set for that service.
Visual Sentinel includes API checks with uptime monitoring. Plans start at $15 per month (Solo, 10 monitors), with uptime checks every 5 minutes and every minute on Business and Agency.
How Does Latency Affect API Performance in Developer Workflows?
Latency is the time an API request takes to complete. High latency can affect applications and workflows. Performance Monitoring provides separate website observations.
Compare endpoint and website observations from Europe and the US where supported. Comparing the two can help you investigate a latency spike or an outage.
Performance monitoring tools can support investigation; a condition such as 250 milliseconds is a user-set example.
What Key Metrics Define API Uptime and Performance Standards?
Review availability, errors, throughput and response-time percentiles such as p95 and p99. Choose objectives for the service and investigate endpoint behavior alongside website checks.
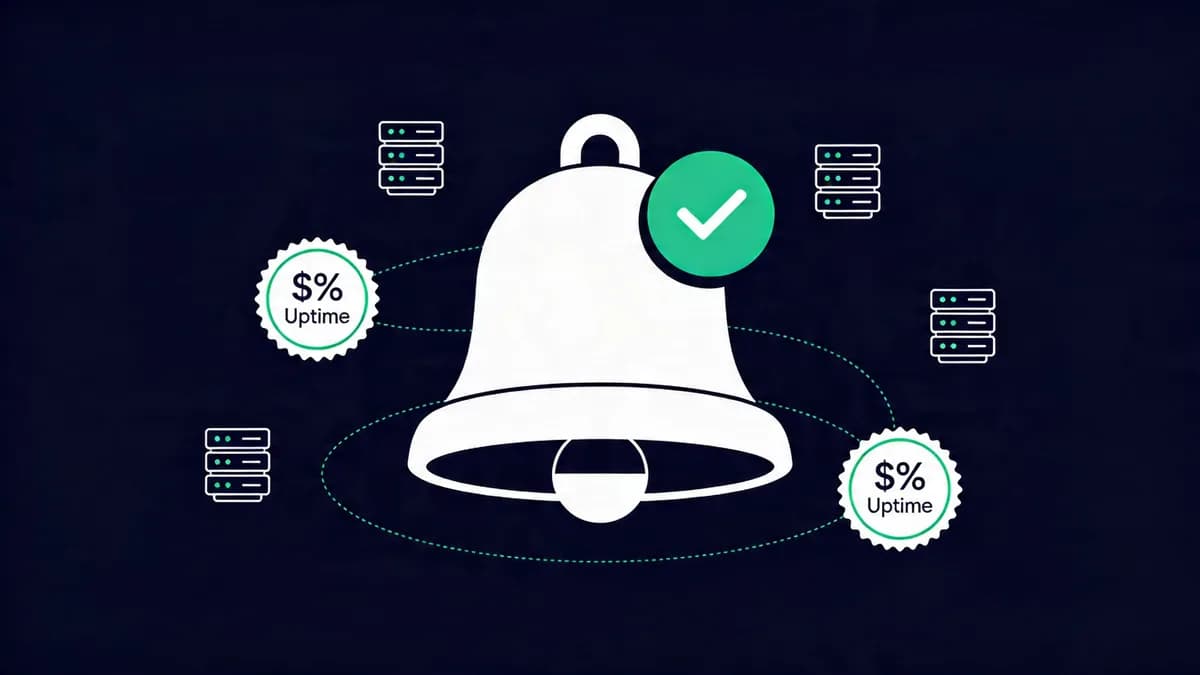
Uptime percentage calculates availability as (total time - downtime) / total time multiplied by 100. Error rates compare failed requests with total requests under the chosen definition, such as 4xx and 5xx responses. Throughput measures requests handled per unit of time.
A team might choose 99.9 percent uptime as an objective. Percentiles describe a response-time distribution rather than ignoring outliers. Speed Test provides a separate website observation, not validation of an API benchmark.
Which Tools Support API Performance Monitoring with Uptime Integration?
Datadog supports API observations, alerting and anomaly detection, but they are not covered by the $15 per host per month Infrastructure Pro price: API tests are synthetic runs billed per run (from $5 per 10,000 runs on annual billing), and anomaly monitors are an Enterprise feature. API monitoring describes Visual Sentinel separately. Grafana Cloud has native Prometheus support. Its Pro plan is a $19 per month platform fee plus usage, and visualization is $8 per active user. Visual Sentinel includes Visual Monitoring from Solo at $15 per month for 10 monitors (1 visual site).
Compare each tool's supported endpoint checks and notification channels. Test alert behavior for the actual service instead of assuming a fixed notification delay or downtime prevention.
Datadog APM keeps traces for 15 days, and log retention is a setting you choose. Grafana Cloud Pro keeps metrics for 13 months and logs for 30 days. Site24x7 offers endpoint monitoring; its Web Uptime plan is $9 per month on annual billing ($10 monthly) for 25 websites with 1-minute intervals.
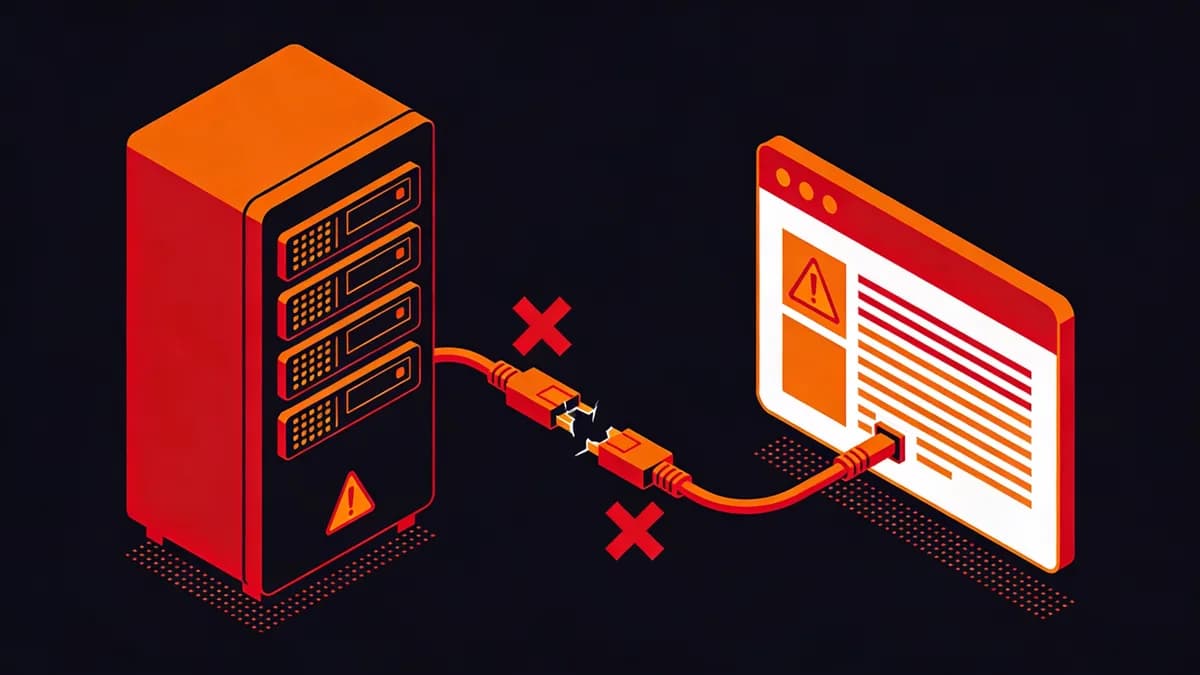
How Do Error Rates Influence API Downtime in Web Applications?
Failed API requests can affect application behavior. Compare error observations with Website Uptime and relevant response data.
Review HTTP 404 and 500 responses alongside other relevant errors. Investigate response patterns and website observations for the cause.
Distinguish 4xx and 5xx observations and review the relevant endpoints. Content Monitoring checks whether expected website text is present.
What Strategies Integrate API Checks with SSL and DNS Monitoring?
Run supported API checks, watch certificate validity and expiry, and check DNS records on a schedule. Visual Sentinel plans start at $15 per month. Alerts support investigation but do not prevent expirations or DNS failures.
SSL Checker checks certificate expiry, chain completeness, hostname coverage and the negotiated TLS version. DNS Checker provides a manual record check.
Review certificate renewal procedures and DNS observations alongside API checks. Renewal and DNS repairs are still your job.
How Does Throughput Measurement Enhance API Performance Strategies?
Throughput measures request volume over time. Review it alongside resource and response observations to plan capacity for the actual workload.
Compare throughput with relevant historical observations and test capacity conditions. Website Checker runs one manual check of a page. It does not test your API.
Investigate throughput changes alongside resource limits and errors.
What Role Does Anomaly Detection Play in API Monitoring Tools?
Anomaly detection identifies deviations from an observed baseline. Levo.ai supports related API observations. Review configured coverage and test alert behavior; a deviation does not itself prove an impending outage.
Tools such as New Relic provide relevant trace observations.
Evaluate anomaly detection against the actual workload. Compare features in Visual Sentinel vs Pingdom.
How to Compare API Monitoring Tools Like Visual Sentinel and UptimeRobot?
Visual Sentinel combines website checks with supported API checks and visual regression testing. Solo is $15 per month for 10 monitors, with uptime checks every 5 minutes; every minute is available on Business and Agency. UptimeRobot provides basic HTTP checks on its Free plan (50 monitors, 5-minute intervals), with paid plans from Solo at $13 per month ($12 billed annually) for 10 monitors at 60-second intervals. Pingdom supports uptime from over 100 locations at $16.50 per month on annual billing ($18 monthly) for 10 monitors.
Visual Sentinel provides supported endpoint checks alongside scheduled DNS observations. UptimeRobot focuses on basic uptime, with no visual monitoring in its uptime plans (a separate free page-change tool covers up to 50 pages). See Visual Sentinel vs UptimeRobot for a feature comparison.
| Tool | Pricing Tier | Check Intervals | Supported Protocols | Alert Latency |
|---|---|---|---|---|
| Visual Sentinel | $15/month (Solo, 10 monitors) | 5 minutes (1 minute on Business and Agency) | Supported endpoint checks; scheduled DNS | on a schedule |
| UptimeRobot | Free (50 monitors); Solo $13/month ($12 annual) | 5 minutes (Free), 60 seconds (Solo) | HTTP, HTTPS, Ping | Set per check |
| Pingdom | $16.50/month annual ($18 monthly), 10 monitors | 1 minute | HTTP, HTTPS, TCP | Set per check |
| Datadog | Synthetic API tests from $5 per 10,000 runs/month (annual) | API tests from 30 seconds | HTTP, HTTPS, gRPC, SSL, DNS, WebSocket, TCP, UDP, ICMP | Set per check |
| Grafana Cloud | $19/month platform fee plus usage; visualization $8/active user | Set per check | HTTP, Prometheus | Set per check |
Visual Sentinel combines supported API checks with website observations. Compare plan limits and the actual workflow for the team.
What Future Trends Shape API Performance Monitoring in 2026?
AI-based analysis, edge deployments and zero-trust controls affect how teams observe APIs.
Test analysis and regional coverage against actual requirements. Explore more in More articles.
Review monitoring needs for serverless services and security controls.
Evaluate the actual service and monitoring requirements.
Test analysis and automated responses in the deployed workflow.
Add supported API checks alongside website Uptime Monitoring. The fastest uptime check is every minute on Business and Agency. Compare plan limits for the intended endpoints.
Ready to try it on the site you run? Start with checks for your own site and the alerts they send.
Check your site while you read
Run a free check for regional reachability, response time, redirect handling, TLS evidence, and DNS resolution. No account is required.
Check a site freeCommon questions
What Is API Performance Monitoring and How Does It Integrate with Website Uptime?
API performance monitoring observes response time, errors and request volume. Compare endpoint observations with website availability to investigate problems.
How Does Latency Affect API Performance in Developer Workflows?
Latency is the time an API request takes to complete. Review the relevant latency distributions alongside separate website Performance Monitoring.
What Key Metrics Define API Uptime and Performance Standards?
Review availability, errors, throughput and response-time percentiles such as p95 and p99. Choose objectives for the actual service.
Which Tools Support API Performance Monitoring with Uptime Integration?
Datadog and Grafana Cloud offer API observations and related integrations. Visual Sentinel provides supported API and website checks.
How Do Error Rates Influence API Downtime in Web Applications?
Review failed API requests and compare them with Website Uptime observations. Errors can affect application behavior even when the site itself stays up.
What Strategies Integrate API Checks with SSL and DNS Monitoring?
Combine supported API checks with certificate validity, expiry and scheduled DNS record observations. These checks alert you. Renewal and DNS repairs are still your job.